DANRA figures#
This notebooks documents and presents the figures created for and included in the submitted manuscript.
Import packages and datasets#
from pathlib import Path
import xarray as xr
import cartopy.crs as ccrs
import matplotlib.pyplot as plt
import numpy as np
import cdsapi
import tempfile
import matplotlib.patheffects as patheffects
import cartopy.feature as cfeature
# Load the zarr DANRA dataset

ds_danra_sl = xr.open_zarr(
    "s3://dmi-danra-05/single_levels.zarr",
    consolidated=True,
    storage_options={
        "anon": True,
    },
)

ds_danra_sl.attrs['suite_name'] = "danra"
# Print dataset information
ds_danra_sl
<xarray.Dataset> Size: 10TB
Dimensions:           (time: 96768, y: 589, x: 789)
Coordinates:
    lat               (y, x) float64 4MB dask.array<chunksize=(295, 263), meta=np.ndarray>
    lon               (y, x) float64 4MB dask.array<chunksize=(295, 263), meta=np.ndarray>
  * time              (time) datetime64[ns] 774kB 1990-09-01 ... 2023-10-13T2...
  * x                 (x) float64 6kB -1.999e+06 -1.997e+06 ... -2.925e+04
  * y                 (y) float64 5kB -6.095e+05 -6.07e+05 ... 8.605e+05
Data variables: (12/31)
    cape_column       (time, y, x) float64 360GB dask.array<chunksize=(256, 295, 263), meta=np.ndarray>
    cb_column         (time, y, x) float64 360GB dask.array<chunksize=(256, 295, 263), meta=np.ndarray>
    ct_column         (time, y, x) float64 360GB dask.array<chunksize=(256, 295, 263), meta=np.ndarray>
    danra_projection  float64 8B ...
    grpl_column       (time, y, x) float64 360GB dask.array<chunksize=(256, 295, 263), meta=np.ndarray>
    hcc0m             (time, y, x) float64 360GB dask.array<chunksize=(256, 295, 263), meta=np.ndarray>
    ...                ...
    t2m               (time, y, x) float64 360GB dask.array<chunksize=(256, 295, 263), meta=np.ndarray>
    tcc0m             (time, y, x) float64 360GB dask.array<chunksize=(256, 295, 263), meta=np.ndarray>
    u10m              (time, y, x) float64 360GB dask.array<chunksize=(256, 295, 263), meta=np.ndarray>
    v10m              (time, y, x) float64 360GB dask.array<chunksize=(256, 295, 263), meta=np.ndarray>
    vis0m             (time, y, x) float64 360GB dask.array<chunksize=(256, 295, 263), meta=np.ndarray>
    xhail0m           (time, y, x) float64 360GB dask.array<chunksize=(256, 295, 263), meta=np.ndarray>
Attributes:
    Conventions:  CF-1.8
    contact:      Leif Denby <lcd@dmi.dk>, Danish Meteorological Institute
    description:  All prognostic variables for 1990-09-01T00:00Z to 2024-01-0...
    license:      CC-BY-4.0: https://creativecommons.org/licenses/by/4.0/
suite_name: danra# Download ERA5 data using the CDS API
# store in a temporary file
dataset = "reanalysis-era5-single-levels"
request = {
"product_type": ["reanalysis"],
"variable": [
"geopotential",
"land_sea_mask"
],
"year": ["1991"],
"month": ["01"],
"day": ["01"],
"data_format": "grib",
"download_format": "unarchived",
"area": [60, 0, -50, 20]
}
temp_file = tempfile.NamedTemporaryFile(suffix=".grib", delete=False)
target = Path(temp_file.name)
temp_file.close()
client = cdsapi.Client()
client.retrieve(dataset, request).download()
# Open the downloaded ERA5 GRIB file and extract fields and lat/lon
target = temp_file

era5_grib = xr.open_dataset(
    target,
    engine="cfgrib",
    backend_kwargs={
        "filter_by_keys": {"typeOfLevel": "surface"},
        "indexpath": ""
    }
)

# Extract fields and coordinates
era5_geopotential = era5_grib['z']  # geopotential
era5_lsm = era5_grib['lsm']         # land-sea mask
era5_lat = era5_grib['latitude']
era5_lon = era5_grib['longitude']

era5_geopotential, era5_lsm, era5_lat, era5_lon
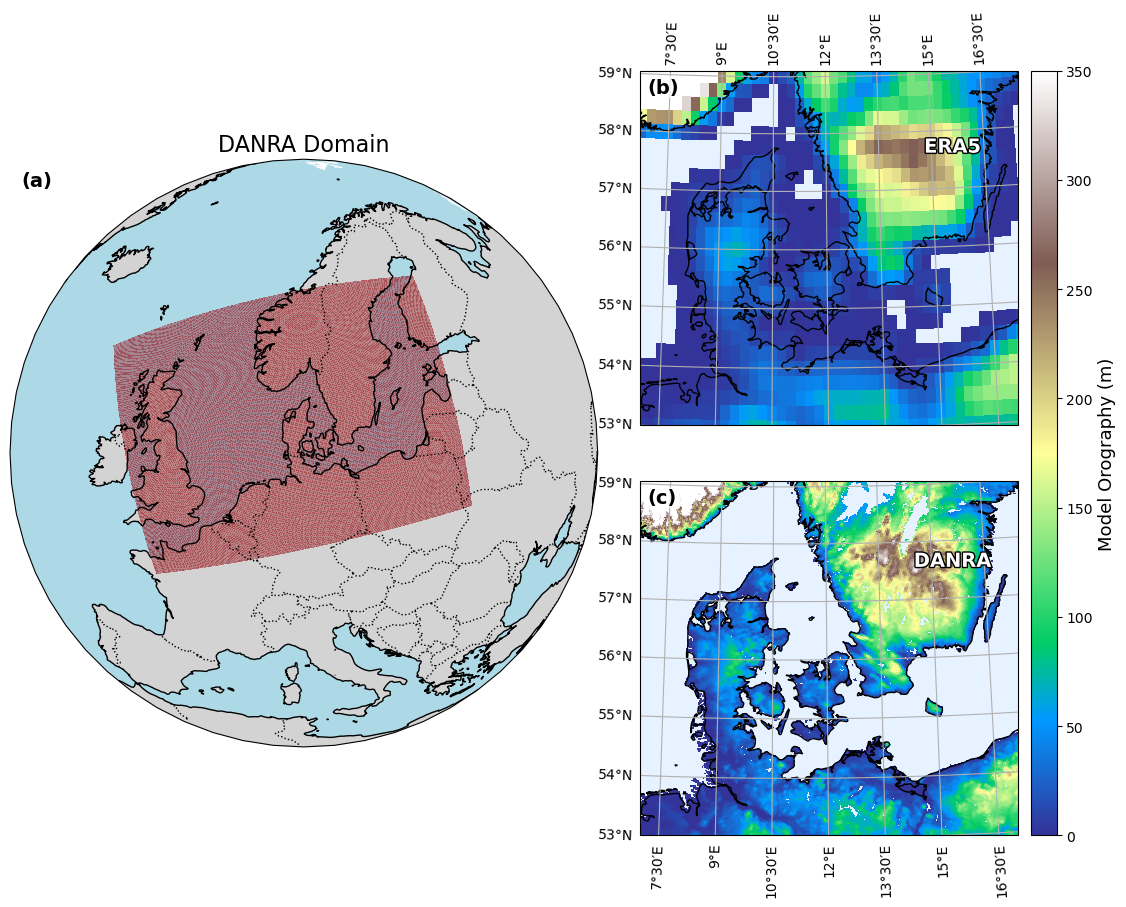
Figure 1: DANRA domain, danra and era5 orography#
# Plot orography for DANRA and ERA5 datasets with bounding boxes in new layout

orog = ds_danra_sl.orography / 9.82  # Convert to meters
orog = orog.where(ds_danra_sl.lsm != 0)  # Set sea points (lsm == 0) to NaN
lat = ds_danra_sl.lat
lon = ds_danra_sl.lon
era_orog = era5_geopotential / 9.82  # Convert to meters
era5_orog = era_orog.where(era5_lsm != 0)

fig = plt.figure(figsize=(13, 10.4))
gs = fig.add_gridspec(2, 5, wspace=0.25, hspace=0.05)

# Globe subplot (left, spans both rows)
ax_globe = fig.add_subplot(
    gs[:, 0:3],
    projection=ccrs.NearsidePerspective(
        central_latitude=55,
        central_longitude=10,
        satellite_height=8.5e5
    )
)
ax_globe.set_global()
ax_globe.coastlines()
ax_globe.set_title("DANRA Domain", fontsize=16)

ax_globe.text(
    0.02, 0.98, "(a)", transform=ax_globe.transAxes,
    fontsize=14, fontweight="bold", va="top", ha="left",
    bbox=dict(facecolor="white", edgecolor="none", alpha=0.7, pad=1)
)

# Draw DANRA domain
ax_globe.add_feature(cfeature.BORDERS, linestyle=':')
ax_globe.add_feature(cfeature.LAND, facecolor='lightgray')
ax_globe.add_feature(cfeature.OCEAN, facecolor='lightblue')
ax_globe.pcolormesh(
    lon, lat, np.ones_like(ds_danra_sl.lsm),
    transform=ccrs.PlateCarree(),
    cmap='Reds',
    vmin=0, vmax=1.1,
    alpha=0.4
)
plot_bbox = [7, 53, 17, 59]  # [min_lon, min_lat, max_lon, max_lat]

# ERA5 orography subplot (top right)
ax_era5 = fig.add_subplot(
    gs[0, 3:],
    projection=ccrs.AlbersEqualArea(
        central_longitude=11.0,
        central_latitude=55.0
    )
)
ax_era5.set_facecolor("#e6f2ff")
mesh1 = ax_era5.pcolormesh(
    era5_lon, era5_lat, era5_orog.squeeze(),
    transform=ccrs.PlateCarree(),
    cmap="terrain",
    vmin=0,
    vmax=350,
    rasterized=True
)
ax_era5.coastlines()
ax_era5.set_extent([7, 17, 53, 59], crs=ccrs.PlateCarree())
gl1 = ax_era5.gridlines(
    draw_labels=True,
    dms=True,
    x_inline=False,
    y_inline=False
)
gl1.top_labels = True
gl1.bottom_labels = False
gl1.left_labels = True
gl1.right_labels = False

# DANRA orography subplot (bottom right)
ax_danra = fig.add_subplot(
    gs[1, 3:],
    projection=ccrs.AlbersEqualArea(
        central_longitude=11.0,
        central_latitude=55.0
    )
)
ax_danra.set_facecolor("#e6f2ff")
mesh0 = ax_danra.pcolormesh(
    lon, lat, orog.values,
    transform=ccrs.PlateCarree(),
    cmap="terrain",
    vmin=0,
    vmax=350,
    rasterized=True
)
ax_danra.coastlines()
ax_danra.set_extent(
    [7, 17, 53, 59], crs=ccrs.PlateCarree()
)
gl0 = ax_danra.gridlines(
    draw_labels=True, dms=True, x_inline=False, y_inline=False
)
gl0.top_labels = False
gl0.bottom_labels = True
gl0.left_labels = True
gl0.right_labels = False

# Create an axis for the colorbar that spans both right subplots
cbar_ax = fig.add_axes([
    0.91,
    ax_danra.get_position().y0,
    0.02,
    ax_era5.get_position().y1 - ax_danra.get_position().y0
])
cbar = fig.colorbar(mesh1, cax=cbar_ax, orientation='vertical')
cbar.set_label("Model Orography over Denmark (m)", fontsize=13)

ax_era5.text(
    0.02, 0.98, "(b)", transform=ax_era5.transAxes,
    fontsize=14, fontweight="bold", va="top", ha="left",
    bbox=dict(facecolor="white", edgecolor="none", alpha=0.7, pad=1)
)
ax_danra.text(
    0.02, 0.98, "(c)", transform=ax_danra.transAxes,
    fontsize=14, fontweight="bold", va="top", ha="left",
    bbox=dict(facecolor="white", edgecolor="none", alpha=0.7, pad=1)
)


fig.text(
    0.85,
    0.78,
    "ERA5",
    color="white",
    fontsize=14,
    ha="center",
    va="bottom",
    fontweight="bold",
    path_effects=[patheffects.withStroke(linewidth=2, foreground="black")],
)

fig.text(
    0.85,
    0.4,
    "DANRA",
    color="white",
    fontsize=14,
    ha="center",
    va="top",
    fontweight="bold",
    path_effects=[patheffects.withStroke(linewidth=2, foreground="black")],
)

plt.show()